The Analytics Widget, located within the "Inventory Health" Dashboard, integrates with services to allow dealers to make informed inventory management decisions.
The Overall Health Widget displays the following information:
| • | Analytics - Analyzes historical results, past experiences and current objective market data. Identifying what is for sale and what is selling in your market. Analytics includes Pricing, Stocking, Sourcing, and Appraisal tools. Analytics includes: eCarList, First Look, Liquid Motors, PureCars, vAtuo.
|
| • | Optimal Zone - Analyzes how a dealership's inventory is priced compared to similar vehicles within the market place. Data is pulled from reliable sources, such as AutoTrader.com and Kelly Blue Book (KBB.com), in determining a vehicle's market value.
|
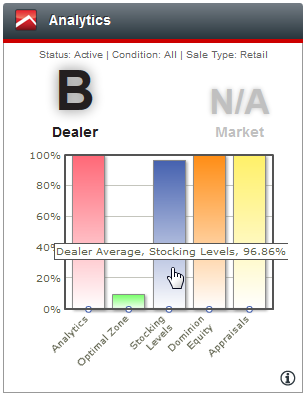
| • | Stocking Levels - Analyzes the dealership's vehicles based on 15 different segments, essential for any dealership. The right mix can and will be different with changes in the economy, seasons, etc. helping to determine which vehicles to wholesale and which vehicles to purchase at auctions.
|
| • | Dominion Equity - Utilizes the Deal Activator application to analyze the best customers for "sales opportunities" based on dealerships vehicles. Deal Activator identifies opportunities from highly qualified, equity customers simply waiting to close. This helps turn current customers into loyal, repeat customers when getting them into a newer vehicle for less money, plus gives the opportunity to get a "premium trade-in vehicle" needed for your inventory.
|
| • | Appraisals - Displays the actual re-sale value of each used vehicle before the vehicle is purchased as well as compares the vehicles to other comparable vehicles in the market for exact pricing and ranking.
|
| • | Grades - Displays visual performance grading score (A, B, C, D, F) as well as recommendations to improve performance. Dealers are presented with a second grading score, used as a comparison to other dealers in the market. |
By hovering over the columns users are able to view the percentage of each category. To customize the information pulled into the widget click on the  button.